
Sometimes it’s just all about that kickstart to get going, and knowing exactly where you are can be the kick in the butt you need! That’s where bio-impedance body composition testing comes in.
Bio Impedance testing is a means of determining the composition of your body, using harmless electrical currents to measure the resistance (impedance) of different parts of the body.
For those of you who would rather watch a video than read, here’s one for you! Warning, it’s got the science stuff in it!
If you’d rather just hear from someone who has done a bio-impedance test and you want to hear what they say instead, click here to see a short two minute video instead!
If you decided to read on, here’s a layman’s version of how it works:
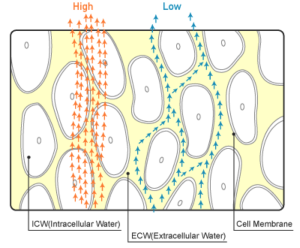
- Sophisticated bio-impedance scales send several harmless electrical currents of different frequencies through the body.
- High frequency currents measure levels of intracellular water, ie they can penetrate cell walls to measure water inside a cell
- Low frequency currents measure extracellular water, ie they can not penetrate cell walls, therefore can only measure the resistance of water outsides cell walls.
So the bio impedance scales measure the amount of water in muscles and fat. The more muscle a body has, the more water it can hold.
The greater the amount of water in a body, the easier it is for a current to pass through it.
The more fat a body holds, the more resistance a current meets.
The more frequencies used in a test, the more accurate it will be. For example, the scales we use at U Can 2 Weight Loss & Fitness for our bio impedance tests, are far more accurate than the fat percentage scales you can buy at a retail store (even thought they are bio impedance scales)
Some bio impedance scales can even measure where fat is located in the body. They can tell you if most of the fat is located in your torso, and how much is on your arms and legs. This is important to know as visceral, or trunk fat, is far more dangerous to your health than fat stored away from your torso.
So why do it, and how will it help you on your health journey?
Easy. As soon as we measure something, we gain knowledge of where you are at, and the difference between now and where you want to be.
Lets use these examples of results from three tests from people all about the same weight, but with vastly different results.
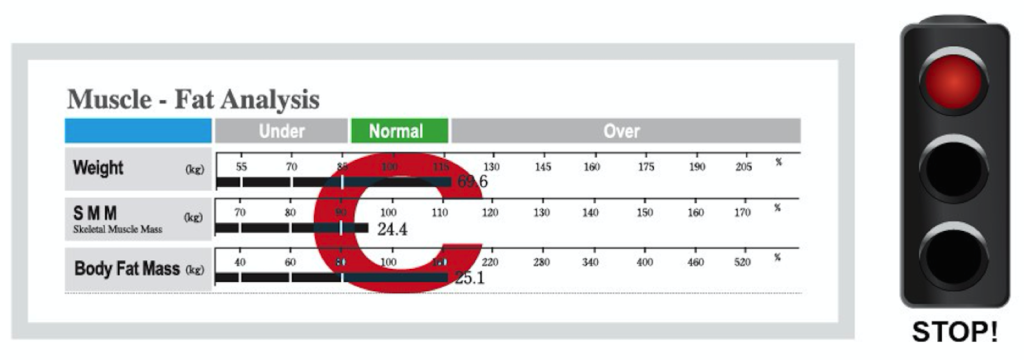
In this first example, we can see that the individual weighs in at 69.6 kg (slightly over normal range), has a Skeletal Muscle Mass (amount of muscle in the body) of 24.4 kg (on the lower range of normal), and 25.2 kg of body fat (slightly over normal)
This is a good example of how a bio impedance test can give you greater insight to your health than say just the BMI scale. In this example, the test has shown the test subject is only slightly above normal ranges, which means if we had their BMI, it too would probably show slightly above normal. In which case this person may just carry on what they are doing. That would be a mistake. You can see that the points on the graph form a C shape, that is a signal to stop what you are doing and make some changes.
This person has too much fat, and not enough muscle. These results would indicate a person who does not work out much (if at all), and whose metabolism would be much lower than desirable.
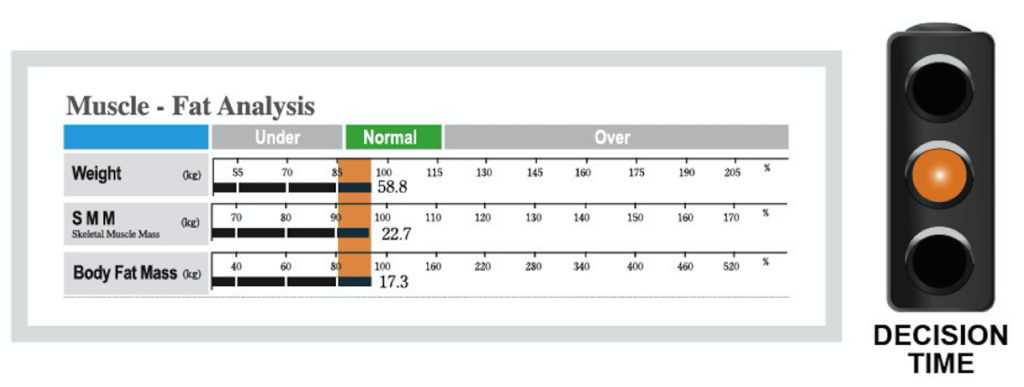
The second example shows an “I” shape on the graph. If we were to pretend that this individual was the same person in the first example who lost weight. This graph would indicate that they had lost weight through diet alone.
This is because they have lost fat, but not gained any muscle (in fact lost a small amount). This graph indicates someone who controls weight through calorie control only, and no exercise. Although this is a more desirable fat result, it is not a good muscle result. A lack of muscle, and in particular losing muscle will slow metabolism and therefore make it harder to maintain or lose weight in the future.
This person looks like they have diet under control, but need to work out.
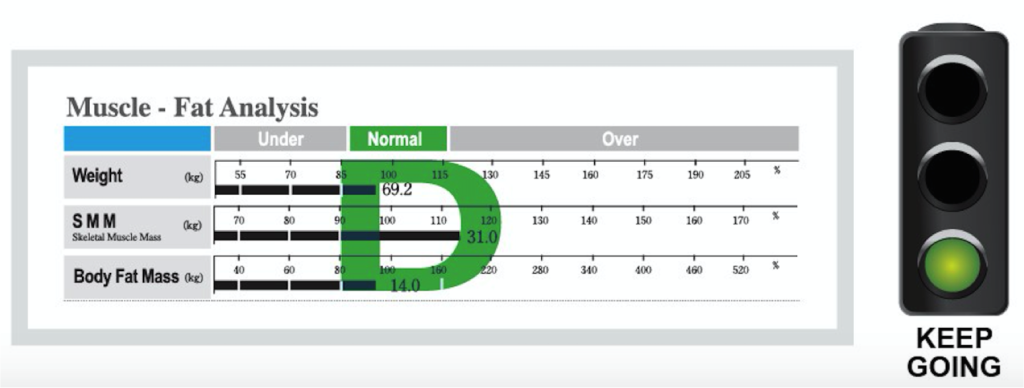
The third example shows a result that creates a “D” shape on the graph.
If you compare the overall weight of the first and last example, you can see they are almost identical at 69.2 kg, but they have a much higher muscle mass of 30 + kg, and much less fat at 14 kg.
This is the graph of a much healthier person. Higher amounts of muscle super charge the metabolism, and will allow this person to eat more, and have more energy day to day. This person not only has eating under control, but exercises regularly.
Please note! They are 10 kg heavier than the second example, and the same weight as the first example – proof that the scales are NOT always the be all end determination of health.
Knowing where you are on this scale will give you the power to know what you have to do, whether it be to improve your nutrition, exercise, or both!
You can have your body composition measured at the next Bio-Impedance measuring day at U Can 2 Weight Loss and Fitness by clicking this link.